Combining Graphs in Physical Science
| Multimedia | Practice Homework | Homework |
Context
We have learned about interpreting and predicting graphs for physical situations. This ability can now be used to see how different graphs relate to each other.
What do we mean by combining graphs?
Equations tell us how to combine variables to get a new property. For example, d=m/V says that if we divide mass by volume it will give the density. The equation tells us how to combine mass and volume to get density. Graphs can also be combined to give a new property.
Explanation
Many times the physical characteristic that we are looking at depends on more than one variable. Density, for example, depends on both mass and volume. This section investigates how to combine individual graphs to predict something that depends on the combination of the individual graphs. We will, for instance, see how to combine mass and volume graphs to predict the density graph.
This section will help you:
- Develop a better understanding of how graphs model physical characteristics.
- Predict graphs that are a result of more than one observable event in a physical system.
Model
Acceleration. As an example of a physical attribute that depends on two variables consider acceleration. Acceleration has to do with the change in an objectís motion. For an object to change its motion there must be an unbalanced force. The ability of a force to move an object depends on the mass, and so the acceleration depends on both force and mass. The greater the unbalanced force the more the motion will change and the greater the acceleration. In other words, the acceleration is directly proportional to the force.
When the mass goes up the change in motion, or acceleration, goes down. It is harder to get a large mass moving or to change its motion once it is moving. It is harder to move a bowling ball than it is to move a ping-pong ball. In other words, the acceleration is inversely proportional to the mass, as the mass goes up the acceleration goes down.
The last two paragraphs give the language model. The corresponding equation is a = F/m, where a is acceleration, F is the force, and m is the mass. Acceleration is the force divided by the mass.
Consider the following situations over a specified period of time: (a) the force is increasing, but the mass is constant, (b) the force is constant, but the mass is increasing, (c) both force and mass are increasing at the same rate. How would the acceleration change in each case? Here are some graphs for each case. Notice that all of the graphs have time on the x-axis. This is important. To add graphs they must have the same variable on the x-axis. Also note that we are looking at columns in this case. Each column is for a different system of force and mass.
(a)
Force Increasing
Mass Constant(b)
Force Constant
Mass Increasing(c)
Force Increasing
Mass IncreasingForce (y) vs Time (x) Mass (y) vs Time (x) Acceleration (y) vs Time (x) These are sketches and are intended to show the basic effect not the exact curve or slope of the line. The idea is that the force makes the acceleration go up when the mass is constant, the mass makes the acceleration go down when the force is constant, and when both force and mass increase at the same rate, the acceleration would not change. If the force increased faster than the mass, the acceleration would go up, but not as steeply as the force. When one goes up and the other goes down, the acceleration would depend on which one is changing faster.
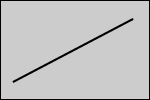
Density when pumping up a rubber ball. Density is directly proportional to mass and inversely proportional to volume. The equation is d = m/V. If the mass increases, but the volume remains the same (like stage I of blowing up a "flat" rubber ball), what do you predict for the graph of the density in this case?
Mass Increasing
Volume ConstantMass (y) vs Number of Pumps (x) Volume (y) vs Number of Pumps(x) Density (y) vs Number of Pumps (x) Did you get it right? This could also be like stage three of blowing up a "flat" rubber ball, where the mass increases, but the volume stays the same (because the rubber can't stretch any more).
How about the case where the mass goes up and the volume goes up at the same rate (possibly like stage two of blowing up a "flat" rubber ball)?
Mass Increasing
Volume IncreasingMass (y) vs Number of Pumps (x) Volume (y) vs Number of Pumps(x) Density (y) vs Number of Pumps (x) What would these graphs look like for the whole process of blowing up a flat rubber ball?
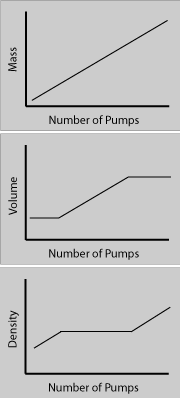
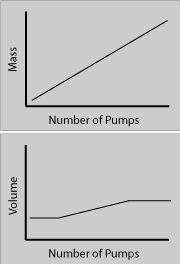
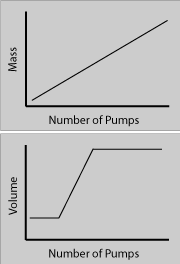
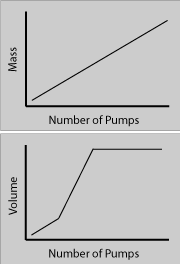
In the first stage the volume remains constant while the mass increases, so the density increases with the same slope as the mass. In the second stage the mass and the volume both increase at the same rate (for this example) and so the density is constant (for this example). In the third stage the mass is increasing and the volume is constant, so the density increases the same as the mass.
Now let's practice with some other possibilities. Here are three sets of mass and volume graphs. Which of the four choices that are given would apply in each case?
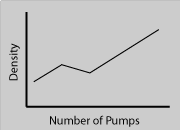
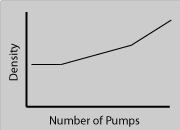
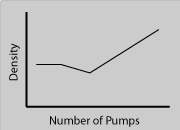
Experiment #1 Experiment #2 Experiment #3 You should try and sketch the density graph on a piece of paper. Here are four possible answers.
(a)
(b)
(c)
(d)In Experiment #1 the first and third stages have the mass increasing and the volume constant. The density would increase with the same slope as the mass in each case. In the second stage the mass in increasing faster than the volume, so the density would increase, but not as much as the mass because the volume increasing would "cancel out" some of the increase due to the mass. Option (b) agrees with this analysis.
In Experiment #2 the first and third stages are the same as in Experiment #1, so the density should increase in those stages. This time, however, the volume is increasing faster than the mass, so the density will decrease. The correct answer for Experiment #2 is (a).
In the first stage of Experiment #3 both mass and volume are increasing at the same rate, so the density will remain constant. In the second stage the volume is increasing faster than the mass, so the density will go down. In the third stage the mass is increasing while the volume is constant, so the density will go up. Option (d) is the correct response.
Consider one more example. Is the density graph correct? Is this situation physically possible?
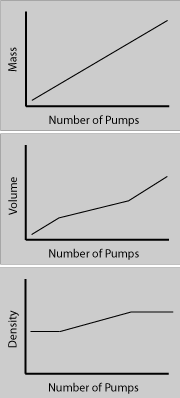
The density graph is correct for the given mass and volume graphs. It is, however, hard to imagine how the volume could increase after the rubber has been stretched completely, which is what we assume in stage III.
Thinking Questions
- Is it possible to predict graphs that are mathematically possible, but physically impossible?
- Can any two graphs be combined?
- Can we combine graphs when both variables are directly proportional?
