Interpreting Graphs in Physical Science
| Multimedia | Practice Homework | Homework |
Context
One of the ways to organize data to better understand what it means is to create graphs. They can be very helpful when trying to understand what is happening in a physical system.
What do we mean by interpreting graphs?
Graphs not only have the data, but they show changes in the data. Looking at those changes allows us to see what is going on in the system. Interpreting graphs means to apply the observed changes in the graph to a physical system.
Explanation
In this section we will practice looking at a graph, identifying the numberical trends described by the graph, and then applying those trends to a physical system.
This section will help you:
- See trends expressed in graphs.
- Relate trends in graphs to observable events in physical systems.
Model
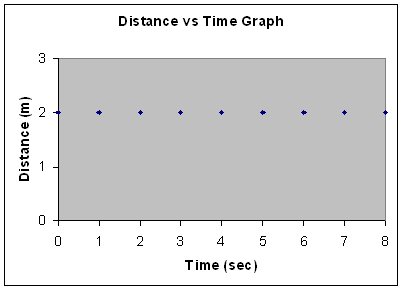
Consider the distance vs time graph shown in Figure 1.
Figure 1When first looking at a graph it is good practice to identify what is happening on the y-axis as the x-axis changes. What is the initial distance? In other words, what is the distance when the time is zero seconds? In this case it is 2 m. What is the distance after 2 sec? In this case it is again 2 m. What is the distance after 4 sec? In this case the distance is 2 m for all of the times shown. In other cases the distance may go up or down as the time gets larger. The first thing to do is just identify the trend. In this example the trend is that the distance remains 2 m as time gets larger.
Once the trend is identified we can think about what it means in a physical system. If we are trying to determine the distance of a ball at various times, what would the data in Figure 1 tell us about the ball? Some questions we may have are: Is it getting closer or farther away? Is it moving fast or slow? Is it moving at all? Etc. What does the data in the graph labeled Figure 1 say?
It is certainly not getting closer or farther away because the distance remains the same. Is it moving at all? Can you think of a situation where a ball could be moving but remain the same distance away? Here is one: What if the ball is on the end of a rope and you are twirling it around you? It would be moving, but in a circle. The distance would remain the same as long as you kept it going in a circle. If, however, we are experimenting with balls rolling down a ramp then a constant distance would suggest that the ball is not moving at all. That is the interpretation of Figure 1: For a ball rolling down a ramp experiment, this graph says that the ball is not moving.
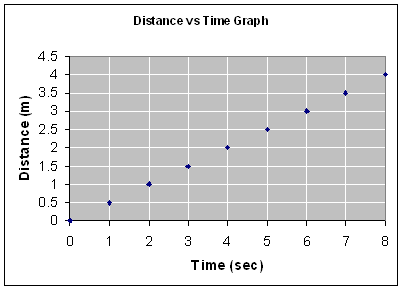
Now consider the following data, generated from measuring the distance a little car traveled down a ramp at various times, that is shown in Figure 2.
Figure 2What does this graph tell us? At zero time the speed was zero, so the car started from rest. As time goes along the distance increases, so the car is moving away from the initial position. From this data can we determine whether the car is speeding up, slowing down, or staying at the same speed? To decide that we would need to know how far the car traveled during the first second (or during some initial time) and compare it to how far the car traveled during the last second (or during some final time). If we look closely we can see that the graph does have that information. The initial speed can be found by determining how far the car went during the first second. The graph tells us that after the first second the car has traveled 0.5 m, so the car is initially traveling at 0.5 m/sec. I am assuming that you have already studied the Basic Graphing Section.
How fast is the car traveling at the end? We can look at the last second and figure that out. We have data for a total of 8 seconds. The last second would be between 7 and 8 seconds. At 7 seconds the car is at a distance of 3.5 m. At 8 seconds the car is at a distance of 4 m. During that last second the car traveled 4 - 3.5 m, or a distance of 0.5 m. So, at the end of our experiment the car was traveling at 0.5 m/sec.
Since the speed at the end of the experiment is the same speed that it was traveling at during the first second, we see that the car travels at the same speed during the whole experiment. When we see linear graphs (graphs that are straight lines) for distance vs time, it means that the speed is constant.
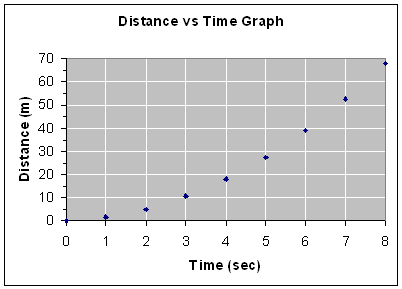
Now consider the following graph (Figure 3) where data was also taken for a car traveling down a ramp.
Figure 3First notice that the graph is not linear, but has the shape of y = x². In this graph the initial position was zero and the distance increases as the time increases. We again observe that the car is traveling away from the initial position. This time, however, it appears that it is moving faster at the end of the experiment. We should check this out.
During the first second the distance goes from zero to some relatively small number that our scale can't give us. We might guess that the number is about 2 m after the first second. The numerical data says that is was actually 1.5 m. Since we have the number, let's use 1.5 m as the position after one second, which means that it was initially traveling at 1.5 m/sec. During the last second it went from something like 52 m (the numerical data gives 52.5 m) to about 68 m (the numerical data gives 68 m), which means it traveled 68 - 52.5 = 5.5 m. At the end of our experiment it is traveling 5.5 m/sec. The car definitely speeds up as it moves down the track in this case. When a car speeds up as it travels down a track we say that it is accelerating. The acceleration that generates this graph is 2.0 m/sec². We say that the car has a constant acceleration of 2 m/sec².
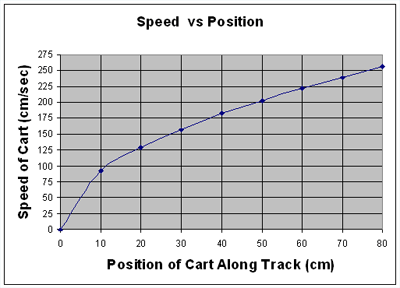
Figure 4 is a graph of data from a teacher workshop for a cart rolling down an inclined ramp. The speed at different positions along the ramp was measured as shown.
Figure 4How is this one interpreted? At zero positon the cart had zero speed, so it started from rest. After traveling 10 cm the cart had a speed of 93 cm/sec. After traveling another 10 cm (a total of 20 cm) the cart had a speed of 129 cm/sec. That was an increase of 36 cm/sec. After traveling another 10 cm (for a total of 30 cm) the cart had a speed of 157 cm/sec. That was an increase of 28 cm/sec. Is the cart slowing down as it goes down the track? I'll let you think about that for a minute.
Notice that the graph is monitoring the speed at different positions along the track, not at different times. Since the speed is increasing with each 10 cm along the track, it will take less time to travel each successive 10 cm increment. That is the same as saying that it is going faster or that the speed increases as the cart goes down the track. From this data it appears that the speed will increase at a constant rate for each 10 cm after a distance of 60 cm has been traveled. Experimentally it was found that the change in speed for the last two increments was 17 cm/sec each.
Other experiments result in data where the increase in speed was smaller for each distance increment as the cart went down the track, suggesting that the cart might effectively go to a constant speed. Indeed, at least for some situations, it has been observed that after a long distance has been traveled the change in speed will be so small that most equipment couldn't measure any difference in the speed. In those situations the cart would have to travel an impossibly long distance before there was a big enough change in speed to measure. In other situations, where there is an opposing force like friction, the cart could really go to a constant speed (and do it in a much shorter distance).
Application: Insight From Teacher Summer Institute
At a recent summer institute for teachers we were doing some experiments with force and motion. A couple of groups decided to look at the speed at the bottom of a ramp or, in a couple of cases, at the bottom of a zip-line. One question being investigated was along the lines of: "If a father and his young daughter went down parallel zip lines, who would get to the bottom first?" This was a lot of fun and as part of this we were able to investigate some of the principles having to do with speed and motion. Another question that came up was how the speed would change with the angle of incline.
At one point we were sharing results from different groups and something like the following comment was made: "We just found the time because speed and time are related." I actually think that there may have only been one of all of the groups who attempted to calculate the speed from the distance and time. All of the other groups just reported the time. We collected the data after the institute, but I haven't obtained a copy yet, so I'll have to give you that data later.
Let's say a group had a 1.0 m ramp and was able to measure the time for a car to get from the top of the ramp, starting at rest, to the bottom of the ramp. What would you predict to happen as the angle is increased? Most of us believe that the higher the angle of the incline, the faster the car will travel. What does that mean in terms of the time? Here is some data and the corresponding graph.
Angle Time Angle Time 5 Degrees 1.53 Sec 50 Degrees 0.52 Sec 10 Degrees 1.08 Sec 55 Degrees 0.50 Sec 15 Degrees 0.89 Sec 60 Degrees 0.49 Sec 20 Degrees 0.77 Sec 65 Degrees 0.47 Sec 25 Degrees 0.69 Sec 70 Degrees 0.47 Sec 30 Degrees 0.64 Sec 75 Degrees 0.46 Sec 35 Degrees 0.60 Sec 80 Degrees 0.46 Sec 40 Degrees 0.56 Sec 85 Degrees 0.45 Sec 45 Degrees 0.54 Sec 90 Degrees 0.45 Sec 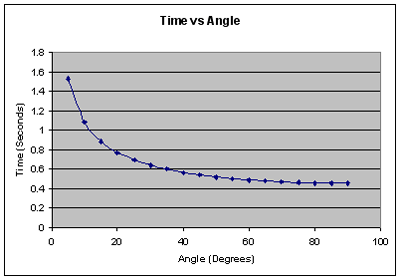
Notice that the graph isn't just a straight line going down. The graph looks a lot like the y=1/x graph that was shown in the Basic Graphing Review. Why is that? Is there a minimum amount of time for the car to roll down the incline? If so, why? If not, why not?
To figure this out we need to know why it rolls down in the first place. What force is applied to make it roll down the incline? The force is gravity. When the car is rolling down the incline the ramp is holding it up and countering some of the force due to gravity. When the incline is level the ramp cancels all of the force due to gravity and the car doesn't move. As the angle increases the ramp counters less and less of the force due to gravity and the car moves faster and faster. If you simply drop the car there is no force acting against gravity and the car will travel as fast as gravity can make it move. Thinking about it this way suggests that there is a maximum speed determined by the force of gravity acting on the car. As the car goes faster it takes less time to travel the 1.0 m of the ramp. Since the speed goes to a maximum, the time must go to a minimum. As the angle gets close to the maximum, the times get closer together around the minimum time as suggested by the graph.
Now, what do you predict for the speed as the angle gets larger? We expect the speed to get larger, but does the graph look like a straight line going up or something else? Since the speed goes to a maximum, we would expect that the graph would start to level off at higher angles. Here is the data and the graph.
Angle Speed Angle Speed 5 Degrees 1.31 m/sec 50 Degrees 3.87 m/sec 10 Degrees 1.84 m/sec 55 Degrees 4.01 m/sec 15 Degrees 2.25 m/sec 60 Degrees 4.12 m/sec 20 Degrees 2.59 m/sec 65 Degrees 4.21 m/sec 25 Degrees 2.88 m/sec 70 Degrees 4.29 m/sec 30 Degrees 3.13 m/sec 75 Degrees 4.35 m/sec 35 Degrees 3.35 m/sec 80 Degrees 4.39 m/sec 40 Degrees 3.55 m/sec 85 Degrees 4.42 m/sec 45 Degrees 3.72 m/sec 90 Degrees 4.43 m/sec 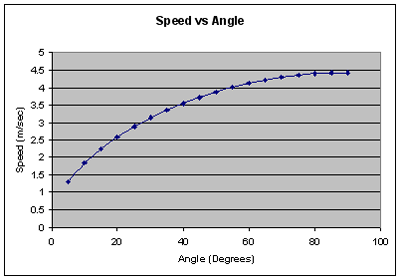
Thinking Questions
- Can most physical science motion experiments be modeled with graphs?
- Do graphs often contain more information than is initially seen?
- Is it only motion experiments that can be modeled using graphs?
