Data Tables, Graphs, and Equations
| Multimedia | Practice Homework | Homework |
Context
In physical science there are many kinds of models to try and help us understand the world around us. Three kinds of models that are often used are data tables, graphs, and equations.
What are data tables, graphs, and equations?
Data tables are numbers representing some physical characteristics arranged in a systematic way. Graphs plot the intersection of numbers that represent two or more physical characteristic. Equations show the relationships among the physical characteristics of the situation being investigated.
Explanation
Tables can have several columns, each representing a different aspect of the physical situation. As you go down a column the situation usually changes; the time increases, for instance. Across the rows of a table the numbers are usually connected in some way; all at the same time, for instance.We will only consider two-dimensional graphs which would correspond to a two column table. In a two-dimensional graph the data points are arranged on a set of perpendicular axes (one axis for each column of the corresponding table; usually labeled the x-axis, drawn horizontally, and the y-axis, drawn vertically). The points on a graph represent the intersection of the data points on each axis (that is the intersection of two numbers in the same row of a table).
Equations show the relationships among variables. With only two variables, the equation allows calculation of one variable if you know the value of the second variable.
This section will help you:
- Better understand tables, graphs, and equations.
- Better understand the connection between tables, graphs, and equations.
Model
The first thing to realize is that tables, graphs, and equations are just three different ways of saying the same thing. Knowing one of them allows you to be able to get the other two.Graphs are separated into an x-axis, which is usually horizontal, and a y-axis, which is usually vertical. These axes are perpendicular, or at 90 degrees, with respect to each other. The range of values appropriate for the variable that is placed along the x-axis is evenly distributed along that axis. The same is done for the variable that is along the y-axis.
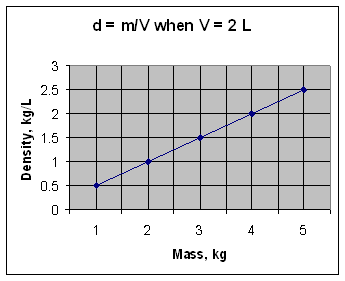
For a given value of the variable along x, the value of the variable along y is calculated from a mathematical relationship. Consider the density relationship, d = m/V, when V = 2 L. If the mass is 1 kg, the density will be 0.5 kg/L. If the mass is 2 kg, the density will be 1.0 kg/L. And so on. The following table shows the calculated values of density (when V = 2 L) for a few different masses.
Mass in kg Density in kg/L 1 0.5 2 1.0 3 1.5 4 2.0 5 2.5 If mass is placed along the x-axis and density is placed along the y-axis, then a graph like the one shown below can be generated by going along x to the value of one of the mass readings, and then going up along the y-axis to the corresponding y-value and putting a dot. This same process is repeated for each value of the mass. Reading a graph uses the same process in reverse. For a density of two, a horizontal line going through the value of two should be drawn across until it crosses the curve. A vertical line is then drawn downward through that intersection point until it crosses the x-axis. The value at that crossing point on the x-axis (4 kg) is the value of the mass corresponding to a density of two and a volume of 2 L.

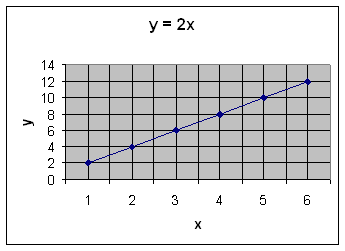
To better understand the connections between graphs, tables, and equations consider the mathematical concept of directly proportional. A short statement that gets to this idea is if two things are directly proportional, then increasing one will also increase the other. The statement “y is directly proportional to x” could be written: y ∝ x. To convert from a proportionality to an equation there needs to be a proportionality constant. These proportionality constants in science are obtained by experimentation. For this example assume the proportionality constant is two. The equation would then be y = 2x. A table can be constructed from the equation by picking an x and then calculating the corresponding y. Here is such a table.
Mass in kg Density in kg/L 1 1 2 4 3 6 4 8 5 10 6 12 These numbers can then be placed on a graph.

Notice that the equation, the table, and the graph are three equivalent ways of expressing the same thing. If someone gives you the equation, you could generate the table and the graph. If someone gives you the table, you could generate the equation, and the graph. If someone gives you the graph, you could generate the table and the equation.
Another mathematical concept that we will need is inversely proportional (or indirectly proportional). Generally speaking this says that if one variable goes up the other one goes down. There is a specific mathematical relationship, however, for inversely proportional. The equation for y inversely proportional to x is in the form: y = 1/x. That is, y is equal to one divided by x.
Thinking Questions
- Does a data table always have a corresponding graph?
- Can you just make up the numbers in a table?
- Is there a unique mathematical expression for every graph?
- Does experimental data always produce nice graphs?